
Abstract
Accurate production forecasting and economic evaluation are foundational to decision-making in the oil and gas industry. These capabilities are not only essential for operating companies managing field development and reserve booking, but also critical for financial stakeholders—including banks, private equity firms, institutional investors, and mineral aggregators—who depend on technically sound forecasts to value assets, underwrite loans, or structure acquisitions and divestitures. In these high-stakes environments, time is often a constraint. Investors and engineers alike are frequently required to deliver a reliable view of an asset’s performance within hours—not days. Legacy platforms such as ARIES® and PHDwin®—while widely used—are not designed for this level of agility. These tools are expensive, opaque, and require significant manual in put, which prolongs the time to insight and introduces risk of human error. In contrast, Schaper Energy Consulting presents a next-generation, open-source platform that leverages AI-enhanced segmented decline analysis, parameterized YAML-based economic modeling, and PRMS compliant deterministic and probabilistic outputs to deliver fast, accurate, and auditable results. The platform was developed from the ground up to meet the dual demands of technical fidelity and business speed. Analysts can ingest raw production data, construct P10/P50/P90 forecasts, and run economics scenarios—all within a cloud-native environment that requires no proprietary software. One of the most significant challenges in reservoir engineering today is the under-utilization of modern AI and statistical optimization techniques. While machine learning has transformed domains like seismic interpretation and drilling automation, production forecasting remains largely untouched, with workflows that have changed little in decades. Many engineers still rely on manual curve fitting, rule-of-thumb adjustments, and opaque spreadsheet-based economics. Our platform breaks from this tradition by embedding Bayesian optimization into the forecasting logic, automatically identifying decline segmentation and optimizing parameters for each production phase. This approach not only
mirrors real well performance more closely, but also eliminates bias and increases reproducibility. In blind back-testing against ARIES, our tool produced PV10estimateswithin 1%oflegacyoutputs, validating its accuracy under industry-standard assumptions. More importantly, it achieved this with over 90% reduction in engineering time, enabling faster turnaround without compromising technical integrity. This paper presents both the technical architecture and the business case for adopting this new forecasting and economics paradigm. It includes real-world validation results across multiple basins and operators, details of our implementation methodology, and a roadmap for integrating these tools into existing workflows. We aim to demonstrate that modern, transparent and scalable tools are not just viable—they are essential for the future of oil and gas asset evaluation.
Problem Statement
In upstream petroleum evaluation, engineers must repeatedly forecast production, model economics, and generate reserve reports. Legacy platforms such as ARIES and PHDwin are widely used, but they present major limitations. Licensing costs often exceed $45,000 per user per year, and workflows require specialized training. Forecasting hundreds of wells can take multiple engineers several weeks. These tools also restrict scenario testing because inputs are hard-coded in opaque project files. Updating LOE, taxes, or price decks often triggers full rework. Furthermore, outputs are difficult to audit or reproduce externally, limiting transparency for auditors and investors. These inefficiencies constrain decision-making and agility, especially for mid-size operators, PE-backed firms, and consultants who need fast, flexible tools. A
more modern approach must address these gaps without sacrificing rigor or compliance.
Technical Background
The traditional reserves workflow involves four key technical stages: data preparation, forecasting, economics, and reporting. Each stage introduces friction in legacy systems.
Data Preparation
Engineers begin by sourcing historical monthly production data from state regulators such as Well Database. This step includes cleaning for missing volumes, irregular time periods, and formatting issues. Data preparation alone can take hours to days depending on asset scale and data quality.
Forecasting
Decline curve analysis is the industry standard for production forecasting. The Arps hyperbolic model:
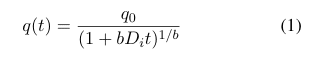
is commonly used but fails to capture the segmented behavior of unconventional wells. Modern shale production typically exhibits early transient decline, mid life boundary-dominated behavior, and late-life exponential tails. Applying a single decline curve often misrepresents reserves and timing. Manual segmentation is time-consuming and subjective. Our system automates this by using changepoint detection to identify natural decline phases. Each segment is then independently optimized using Bayesian techniques (e.g., TPE via Optuna) to find the best-fitting parameters. This process is reproducible and fast, requiring no manual tuning.
Economic Modeling
Following forecasting, engineers must apply financial assumptions to translate future volumes into economic
value. This includes incorporating commodity price decks, differentials, lease operating expenses (LOE), capital expenditures (CapEx), and both severance and ad valorem tax rates. Traditional software tools embed these inputs deep within proprietary project files, making updates difficult and error-prone. Our system externalizes all economics into structured YAML configuration files. For example, a user can define a price deck as follows:
price_deck:
oil: {base: 75, escalation: 2%}
gas: {base: 3.5, escalation: 1.5%}
and expenses as:
opex:
fixed: 8000
variable: 1.25
taxes:
severance: 4.6%
ad_valorem: 2.0%
This approach enables users to easily manage assumptions across scenarios, collaborate via version control, and rapidly test sensitivities without modifying source code or recompiling models.
Reporting
The final stage involves packaging results into a format suitable for executives, investors, auditors, and regulatory filings. In legacy workflows, engineers spend significant time formatting outputs into Excel, cleaning up one-line summaries, and manually assembling PDF re
ports. Our platform automates this by generating all necessary output formats directly from the Colab notebooks. The outputs are consistent, fully auditable, and standardized across runs. Reporting can be repeated in seconds after changing inputs, enabling iterative work flows and rapid re-forecasting cycles.
Proposed Solution
Schaper Energy Consulting has developed two complementary tools: the SE Oil Gas Auto-Forecasting Tool and the SE Economics Engine. These tools operate together within a modular, cloud-native workflow that replaces cumbersome legacy software and empowers technical teams to rapidly evaluate development scenarios. The SE Auto-Forecasting Tool, built in Python and deployed via Google Colab, automates the end-to end forecasting process. Users upload historical production data in CSV format, and the notebook algorithmically detects segmented decline trends using Bayesian optimization. It identifies and fits decline parameters for each production phase—oil, gas, and water—generating accurate, multi-segment forecasts. These include exponential, hyperbolic, and hybrid hyperbolic-to-exponential decline models, ensuring flexibility across reservoir and well types. Crucially, the tool supports Type Curve generation by phase, enabling analysts to create distinct type curves for oil, gas, and water production based on aggregated well data. Users can apply normalization factors such as lateral length to adjust individual well contributions and standardize performance across varying completion designs. The tool allows comprehensive filtering of wells by vintage, operator, reservoir, landing zone, or other attributes, giving users granular control over data inclusion criteria. This enables
cleaner curve construction and facilitates benchmarking or cross-operator analysis. Forecasts are automatically generated for P10, P50, and P90 probabilistic cases, aligned with PRMS reserves classification standards. Outputs include segmented decline forecasts, diagnostic plots for quality control, and formatted production profiles ready for use in economics or reserves workflows. Once forecasts are finalized, the SE Economics Engine simulates full-cycle project economics. Users define assumptions in human-readable YAML files, including oil and gas price decks, basis differentials, fixed and variable lease operating expenses (LOE), drilling and completion capital expenditures, production taxes (severance and ad valorem), and contractual interests such as working and royalty percentages. This decoupling of model logic from input assumptions allows rapid scenario analysis—users can easily modify case drivers without editing underlying code. Together, these tools offer a highly flexible, transparent, and auditable alternative to opaque, legacy desktop software. They are designed to integrate seamlessly
into modern analytical workflows and support efficient, scalable field development planning.
Monthly cashflows are calculated using:
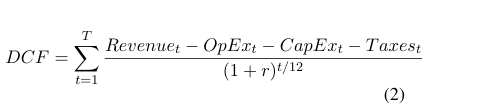
Where r is the discount rate, typically 10% for PV10.
Visualization and Reporting
The system outputs:
• Production plots with forecast overlays
• Type curves by zone, vintage, or operator
• Spaghetti plots for all wells in a dataset
• Probit charts for log-normal EUR visualization
• Excel and PDF reports for monthly cashflows, PV metrics, and summary statistics
All outputs are reproducible, standardized, and fully auditable.
Validation and Results
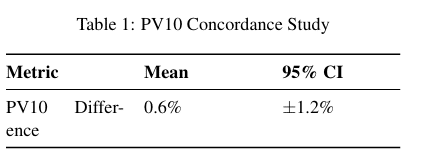
In Q1 2025, Schaper conducted a blind benchmark using 250 horizontal wells from the Permian Basin. Senior engineers created ARIES forecasts manually. The same historical data and economic assumptions were processed through the Colab-based SE AI system. The results showed a PV10 deviation of only 0.6% on average, with a 95% confidence interval of ±1.2%. Forecasts were generated for all wells in under 1 hour, compared to more than a week of manual effort.
In a separate deployment, 200 legacy wells in Lampasas County, TX were refitted using the platform. Type curve models replaced blanket declines. EUR increased by 7% and PV10 improved from $241MM to $259MM.Theresults were shared with auditors and investors via PDF oneline reports and monthly cashflows, enhancing transparency and confidence.
Business Impact
The combined time savings, cost savings, and increase in modeling transparency result in clear economic advantages for technical teams using Schaper’s solution. Legacy platforms demand high fixed costs and time intensive workflows. By contrast, the SE AI system offers a nimble and modern architecture. It replaces the need for proprietary licenses and sharply reduces analyst workload.
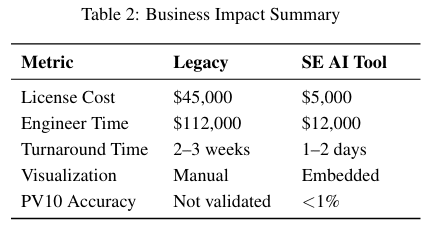
The workflow eliminates redundant tasks and allows staff to focus on value-added engineering. Faster forecasts also enable more responsive management decisions in M&A, hedging, budgeting, and reserves booking scenarios. Total savings exceed $150,000/year per technical seat, even before considering the strategic agility un locked by rapid reforecasting and scenario switching.
Conclusion
Legacy forecasting tools were designed in a different era—before unconventional development, cloud computing, and agile finance. Today, the pace of decision making demands a faster, smarter, and more transparent approach. Schaper Energy Consulting’s AI-powered forecasting and economic modeling platform offers a validated alternative. It delivers ARIES-equivalent PV10 accuracy with a fraction of the time, cost, and complexity. Its YAML-based configuration structure ensures clarity and flexibility, while integrated plots and reports support investors, management, and auditors alike. By automating decline fitting, externalizing economics, and using cloud-native delivery, the system transforms petroleum evaluation from a manual bottle neck into a strategic advantage. Operators can evaluate opportunities quickly, defend reserves assumptions transparently, and respond rapidly to commodity shifts. This is more than just a tool — it is a new standard for oil and gas forecasting.
References
- Halliburton, “ARIES Petroleum Economics Software,” 2023. Available: https://www.landmark.solutions/aries
- TRC Consultants, “PHDwin Decline Curve Analysis Software,” 2023. Available: https://www.phdwin.com
- Arps, J.J., “Analysis of Decline Curves,” Transactions of the AIME, 1945.
- Kamal, M., “Machine Learning Applications in Oil and Gas Forecasting,” JPT, 2019.
- Google Research, “Google Colaboratory,” 2024. Available: https://colab.research.google.com